Wordpress Web Forensics LetsDefend Writeup
This writeup documents my analysis and investigation of the WordPress Web Forensics challenge on LetsDefend. The objective was to investigate a wordpress server breach using the web server logs and Splunk.
After setting up the provided log source let’s dive in..
What is the attacker’s IP address from which the WPScan enumeration originated?
“WPScan WordPress security scanner. Written for security professionals and blog maintainers to test the security of their WordPress websites”
My initial assumption was that WPScan was not designed to be stealthy and used maliciously so it should reveal itself via its useragent string.
I used the following query:
source="logs.zip:*" "WPScan
Press enter or click to view image in full size
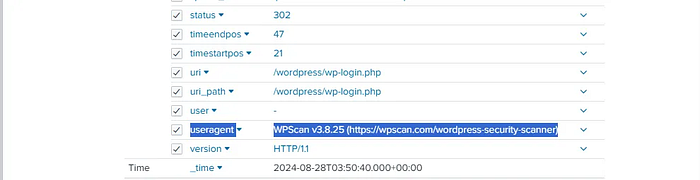
Immediately returns results, confirming that the tool does exposes itself through the useragent field. Giving us the answer for the first question 203.101.190.116
When did the attacker begin reconnaissance activity?
To determine when reconnaissance began, I reran the same query and sorted the results by timestamp:
source="logs.zip:*" "WPScan" | sort _time
The earliest event associated with WPScan occurred at “2024–08–28 03:15:23”
Which version of the tool was used by the attacker?
Since WPScan exposes its version in the useragent string, this information was easily obtained from the same event.
The version used by the attacker was WPScan v3.8.25
The attacker performed a brute-force attack on the WordPress login form.
How long did this activity last before successfully obtaining valid credentials?
This this took some time to figure out, this is how i did it.
First, I searched for all POST requests to the WordPress login endpoint:
source="logs.zip:*" uri_path="*wp-login.php" method="POST"
This query returned 252 events which is a lot to sift through manually, ****i looked at the latest request sent which i assumed was the one where the attacker got access.
source="logs.zip:*" uri_path="*wp-login.php" method="POST" | sort - _time
The most recent request had a 302 redirect status code and included a redirect web parameter pointing to “/wordpress/wp-admin/”.
Press enter or click to view image in full size
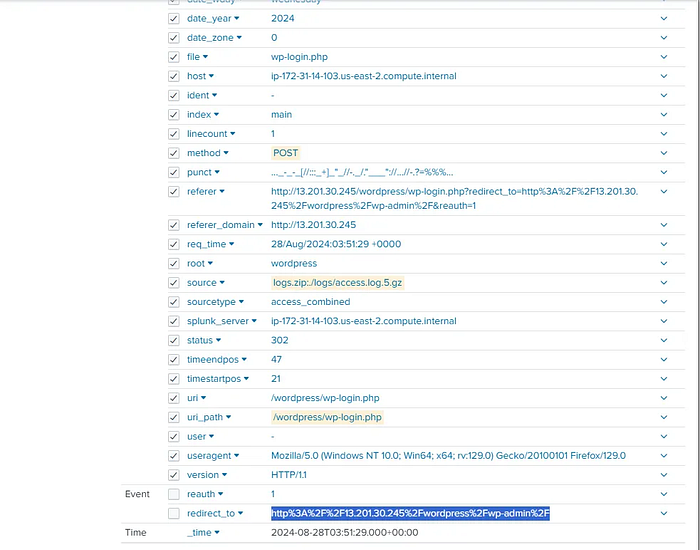
Interestingly the event immediately before this also returned a 302 status code but did not include a redirect parameter, while the rest of the login attempts returned a 200 status code response likely indicating failed login attempts.
To better visualize the sequence, I grouped the login events by timestamp and status code
source="logs.zip:*" uri_path="*wp-login.php" method="POST" | stats count by _time, status
Press enter or click to view image in full size
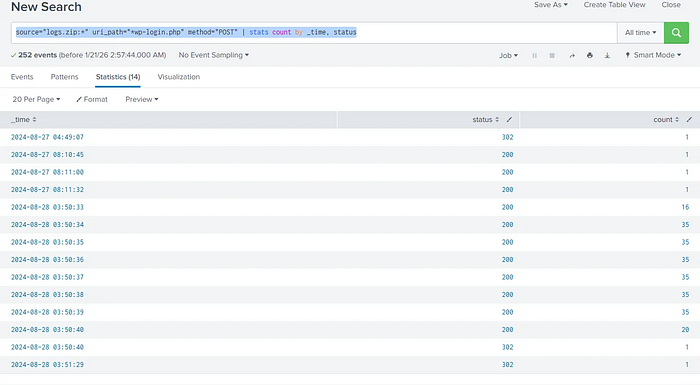
Did you catch it yet? the last login (sent on 03:50:40) was made on a real browser by a human hence explains the redirect webparam. Meanwhile the event just before it (sent on 03:50:33) is the one where WPScan finds the correct creds, the difference between starting the bruteforce and finding the credentials is “7 seconds”.
The attacker manipulated a WordPress theme file to maintain persistence.
Which WordPress theme was targeted?
To identify activity involving theme modification, I searched for requests related to the themes directory using the following query:
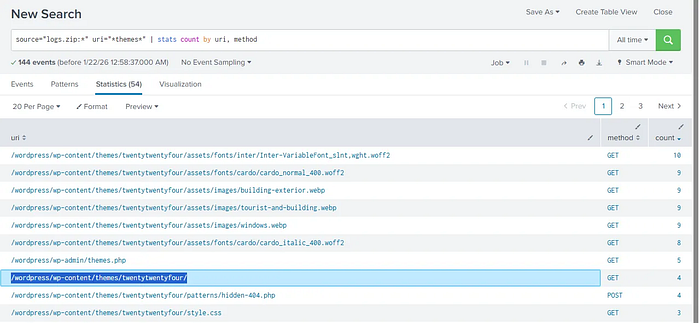
source="logs.zip:*" uri="themes" | stats count by uri, method | uniq
Multiple requests were observed targeting the twentytwentyfour theme, indicating that it was the theme used for persistence.
Press enter or click to view image in full size
What is the name of the PHP theme file used as a web shell entry point?
Next i examined which theme files received POST ****requests, as i assumed modifying a file for a theme would result in a POST request.
The only PHP file within the theme directory that received POST requests was “/wordpress/wp-content/themes/twentytwentyfour/patterns/hidden-404.php”
Giving us the answer hidden-404.php
When did the attacker first run a command via the web shell?
Filtering for POST requests to the specified file:
source="logs.zip:*" uri_path="/wordpress/wp-content/themes/twentytwentyfour/patterns/hidden-404.php" method="POST"
we can see the first post request was sent at “2024–08–28 04:03:51” which is the correct answer.
What User-Agent was used by the attacker during web shell interaction?
Inspecting the same event from the previous question revealed the following useragent “Mozilla/5.0 (Windows NT 10.0; Win64; x64; rv:129.0) Gecko/20100101 Firefox/129.0”
Conclusion
This was a fun challenge though a little short but defenitly valuable. I hope to see you in the next writeup, Stay safe.